Gapminder: Wealth and health of nations
Practice joining four tables by country and year to build a Hans Rosling-style bubble chart of GDP per capita, life expectancy and population, colored by region and animated by year.
Question
In 2006, the Swedish physician and statistician Hans Rosling gave a TED talk that made data visualization famous. Using software from his Gapminder Foundation, he showed every country as a bubble: GDP per capita on the x-axis, life expectancy on the y-axis, bubble size for population and color for world region. When he pressed play, the bubbles moved year by year, and the audience watched most of the world grow both healthier and wealthier. The talk challenged the old split between a rich "developed" world and a poor "developing" world.
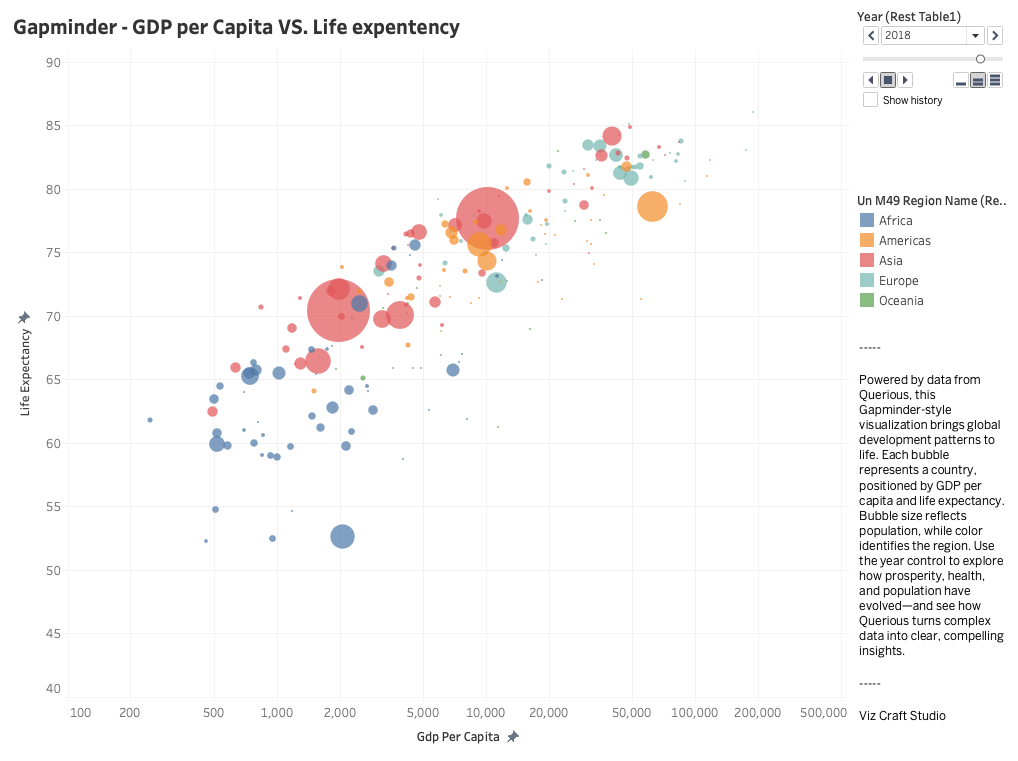
Rebuild the Gapminder chart with Querious data. Join four tables so that each row is one country in one year, then plot an animated scatter plot colored by region. Press play: which regions move fastest, which countries break away from their region, and in which years does the pattern shift?
Tables to use
ER diagram
country_iso_alpha3country_nameyeargdp_per_capita_current_usdcountry_iso_alpha3yearlife_expectancy_at_birth_yearsworldbank_gdp_per_capita.country_iso_alpha3 = worldbank_life_expectancy_at_birth.country_iso_alpha3 + year · one GDP-per-capita observation to one life-expectancy observation for each country and year
country_iso_alpha3yearcountry_iso_alpha3yearpopulation_totalworldbank_gdp_per_capita.country_iso_alpha3 = worldbank_population_total.country_iso_alpha3 + year · one GDP-per-capita observation to one population observation for each country and year
country_iso_alpha3country_iso_alpha3un_m49_region_nameworldbank_gdp_per_capita.country_iso_alpha3 = country_geography.country_iso_alpha3 · many yearly observations to one UN M49 geography row per country
Guide
Analysis requirements
- Join
worldbank_gdp_per_capita,worldbank_life_expectancy_at_birthandworldbank_population_totalon bothcountry_iso_alpha3andyear, then joincountry_geographyoncountry_iso_alpha3only, to addun_m49_region_name. - Keep only rows where all three measures are non-null. Each output row should be one country in one year.
- Build a scatter plot: x =
gdp_per_capita_current_usd(use a log scale), y =life_expectancy_at_birth_years, bubble size =population_total, color =un_m49_region_name, animation frame =year. - Country coverage changes over time (about 110 countries in 1960 and more than 200 from the 1990s). Report how many countries appear in each year, because bubbles appearing later are not new countries growing.
gdp_per_capita_current_usdis in current US dollars, not adjusted for inflation or purchasing power. Over many decades, part of the movement to the right is inflation, so compare positions within a year more than distances across years. The original Gapminder chart uses inflation-adjusted PPP dollars.- Region colors use the five UN M49 regions (Africa, Americas, Asia, Europe, Oceania), not Gapminder's own four-region grouping. A cross-country association does not establish causation.
Suggested query
Expand suggested query
SELECT g.year,
       g.country_iso_alpha3,
       g.country_name,
       r.un_m49_region_name AS region,
       g.gdp_per_capita_current_usd,
       l.life_expectancy_at_birth_years,
       p.population_total
FROM worldbank_gdp_per_capita AS g
JOIN worldbank_life_expectancy_at_birth AS l
  ON g.country_iso_alpha3 = l.country_iso_alpha3
 AND g.year = l.year
JOIN worldbank_population_total AS p
  ON g.country_iso_alpha3 = p.country_iso_alpha3
 AND g.year = p.year
JOIN country_geography AS r
  ON g.country_iso_alpha3 = r.country_iso_alpha3
WHERE g.gdp_per_capita_current_usd IS NOT NULL
  AND l.life_expectancy_at_birth_years IS NOT NULL
  AND p.population_total IS NOT NULL
ORDER BY g.year, region, g.country_name;